
How Do Flow and Shrinkage Change When Increasing Glass Fiber from 30% to 50%?
工艺参数17 min read
On this page
For the same material, varying glass fiber content leads to significant performance differences. With three common grades—30%, 40%, and 50%—customers often ask whether higher fiber content means greater stiffness.
The answer isn't simply "more stiffness." This article explains how glass fiber content influences flow, shrinkage, and anisotropy.
Glass fibers increase melt viscosity
Glass fibers are solid; adding them to the melt increases viscosity. Higher fiber content results in higher viscosity and more difficult flow.
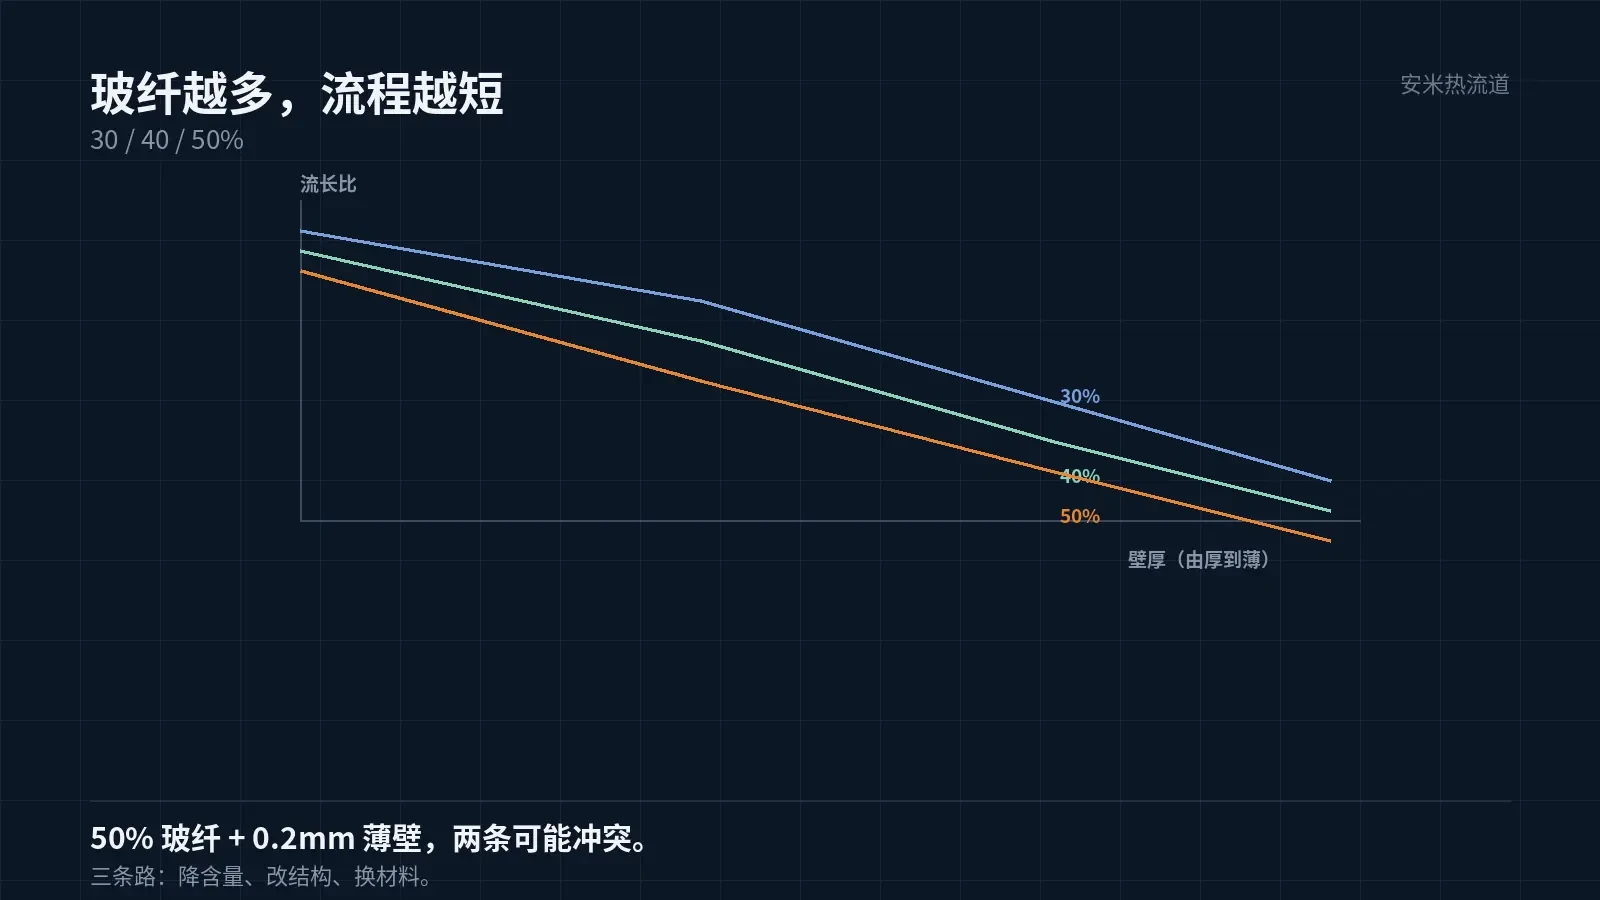
Increased viscosity effects: at the same pressure, flow length is reduced; for the same flow length, higher pressure or temperature is required.
Therefore, materials with high glass fiber content make filling thin-wall parts more difficult and significantly reduce the flow length ratio.
This must be determined at selection time. For example, if a customer needs 50% glass fiber for a 0.2mm thin-wall part, these requirements may conflict.
Options for resolving conflicts: reduce glass fiber content, modify part geometry, or change material. Each approach involves trade-offs.
Reducing content lowers stiffness and requires re-evaluating part strength; modifying geometry necessitates mold changes; changing material demands new certification. Since costs vary, select based on your project stage.
Another overlooked factor: glass fiber content affects weld line strength. Higher fiber content hinders fiber bridging at weld lines, reducing strength.
Weld line location is determined by the gate. Weld lines form around inserts, holes, and where melt fronts meet. For high-glass-fiber parts, keep weld lines away from load-bearing areas.
Glass fiber content also affects wear resistance and friction. Higher content improves wear resistance but increases mold abrasion. Adjust mold steel selection and surface treatment accordingly.
For long-life molds, inspect gates and runners regularly. As wear progresses, gate dimensions increase, leading to larger gate vestiges on the part.
Glass fibers cause significant wear on screws and barrels. Barrels processing high-glass-fiber materials have shorter lifespans than those for standard materials; wear-resistant screws are required.
Shrinkage decreases, but anisotropy increases
Glass fibers shrink significantly less than resin. Higher glass fiber content reduces overall shrinkage, which is why adding glass fiber improves dimensional stability.
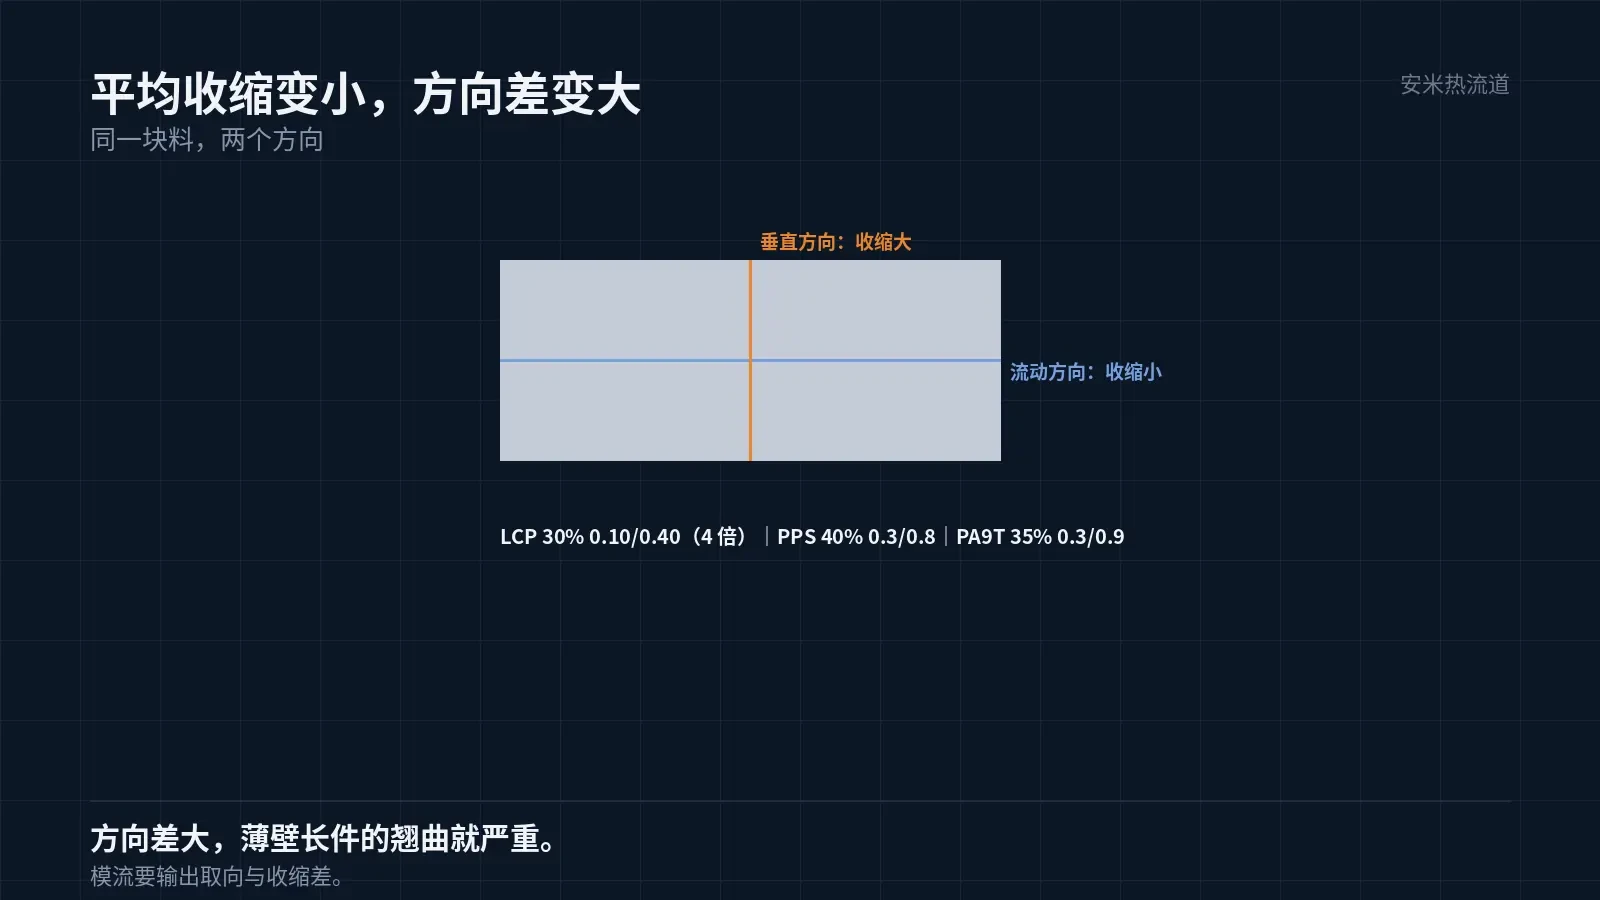
However, glass fibers are oriented. Shrinkage is lower in the flow direction and higher in the transverse direction. This directional difference increases with higher fiber content.
LCP with 30% glass fiber: shrinkage 0.10%/0.40%, anisotropy factor 4; PPS with 40%: 0.3%/0.8%; PA9T with 35%: 0.3%/0.9%.
These figures differ not only in content but also in the resin itself. With the same 30% glass fiber loading, shrinkage varies by resin type.
Therefore, the claim that "adding glass fiber reduces shrinkage" is only partially true. It lowers average shrinkage but increases directional variation.
A larger directional difference causes severe warpage. In thin-walled, long-flow conditions, 80% of warpage is due to this directional difference.
Glass Fiber Orientation Is Determined by Flow Field
In the melt, glass fibers are rod-shaped. As the melt flows, the fibers align with the flow direction. Higher flow velocity leads to more pronounced orientation.
Flow velocity is high near the gate, leading to strong fiber orientation; it is low at the cavity end, resulting in weak orientation. Within a single part, orientation varies by location.
Different orientations cause varying shrinkage rates, resulting in non-uniform part dimensions and mismatched measurements across directions within the same part.
Orientation is controlled by managing the flow field. Gate position, runner geometry, and injection speed all affect orientation.
For parts with high glass fiber content, mold flow analysis must focus on fiber orientation. Analyzing filling alone reveals no issues.
Orientation is also influenced by injection speed. High speeds increase shear and orientation, while low speeds reduce both but risk short shots. These two parameters must be balanced together.
Mold temperature also affects orientation. Higher mold temperatures slow melt cooling, giving fibers time to relax and resulting in weaker orientation.
Mold flow software calculates the orientation tensor and reports shrinkage variations across locations. This analysis is required for thin-wall, long-flow conditions.
Mold flow orientation results must be compared with actual measurements. The discrepancy between calculated and measured shrinkage is critical for model validation.
If results don't match, first verify you used the correct material grade data. Using generic data for specific grades will produce inaccurate results.
Fiber distribution may also be non-uniform
Glass fibers migrate within the melt: high-velocity regions contain fewer fibers, while low-velocity regions contain more.
Near the gate, high flow velocity washes away fibers, leaving more resin; at the end of filling, low flow velocity causes fiber accumulation.
Consequently, strength is lower and shrinkage is higher near the gate, while strength is higher and shrinkage is lower at the end of the fill.
This non-uniformity is visible under microscopic cross-sectioning. Acceptance inspection requires cutting samples to verify glass fiber distribution, a process more thorough than dimensional checks alone.
Glass fiber accumulation also causes cosmetic defects such as fiber float and flow marks. These are difficult to pass for appearance-critical parts.
Fiber float is controlled by mold temperature and injection speed. Higher mold temperatures and faster injection speeds reduce surface fiber float but worsen orientation.
Verification: Shrinkage, Warpage, Sectioning
Group 1 (Shrinkage): Measure flow and transverse directions per ISO or customer standards. Group 2 (Warpage): Check flatness for plate parts and straightness for long components. Group 3 (Sectioning): Examine glass fiber distribution and orientation.
Among the three groups, Group 1 is foundational, Group 2 best represents the issue, and Group 3 most clearly explains the cause.
Specify material grade, glass fiber content, wall thickness, flow length ratio, and warpage requirements. We will verify flow and orientation before providing a quote.
MATCHED BY MATERIAL AND DEFECT
This article covers stringing, drooling, clogging, and high-heat resins; refer to SD for gate freeze and break-off.
Register for a selection review and quote
Submit part, mold, and material details. Our engineers will evaluate the gate solution per part and provide a quote.
Upload a 2D layout drawing using the form.
Online selection and quote
Scan to register